

#5-KPIs
Table Of Content
1. Introduction
Think of customer success metrics as your business's vital signs - they tell you if your customer relationships are healthy or need some serious attention. You wouldn't drive blindfolded, right? So why run your operations without keeping tabs on how your customers are actually doing?
Let's break down the most important metrics into three categories:
those that show if your customers are on-track to reach their goals
those that show how well you're engaging with customers
those that tell you if you're making money
2. Customer Metrics
1. The Success Metric (The One Metric That Rules Them All)
Remember what you should be doing during onboarding? Drawing a blank?
No sweat - here it is again:
"Get crystal clear on what 'winning' looks like for them (with actual numbers to aim for)"
This is the golden metric that trumps everything else. Why? Because it tracks their journey toward what they actually care about.
I wish I could hand you a one-size-fits-all template here, but success is as unique as your customers. Your job is to uncover their pain point, show how you solve it, and define what victory looks like in clear terms.
Once you've nailed this down, build a simple process to track this metric regularly. Are they on track to hit their goals or veering off course?
Some practical ways to measure success:
The specific reasons each customer signed up
Their percentage of goal achievement (the most direct measure)
For this, work smarter, not harder. Simply re-use what you logged into each customer’s Success Plan.
Tip: Want to track performance across your entire portfolio? Create a single metric like "percentage of customers on track to meet or exceed objectives." This gives you a bird’s-eye view in seconds.
Remember this: whether your customers are crushing it or struggling, your job is to impact their success metrics. Focus there, and the value should follow naturally.
2. Lifecycle Metrics
These metrics tie directly to your customer success lifecycle - specifically the key milestones you want customers to reach. You'll need to log these events in your CS platform (or your CRM if budget is tight).
I've used this approach with great results. In fact, customers who hit both our key milestones had a 91% renewal rate. That's not just a correlation - it's practically a crystal ball.
Milestone completion rate works like this:
Using a real example from my time at Phantombuster, our onboarding milestone was: "Customer launches their first automation and collects 5 entries."
We tracked two components:
Did they launch their first automation? (accounting for 50% of the completion rate)
How many entries collected? (the other 50%)
So if a customer launched automation but only gathered 3 entries, they'd hit 80% completion (50% + 30%).
Start by tracking two core milestone rates: Onboarding and Adoption.
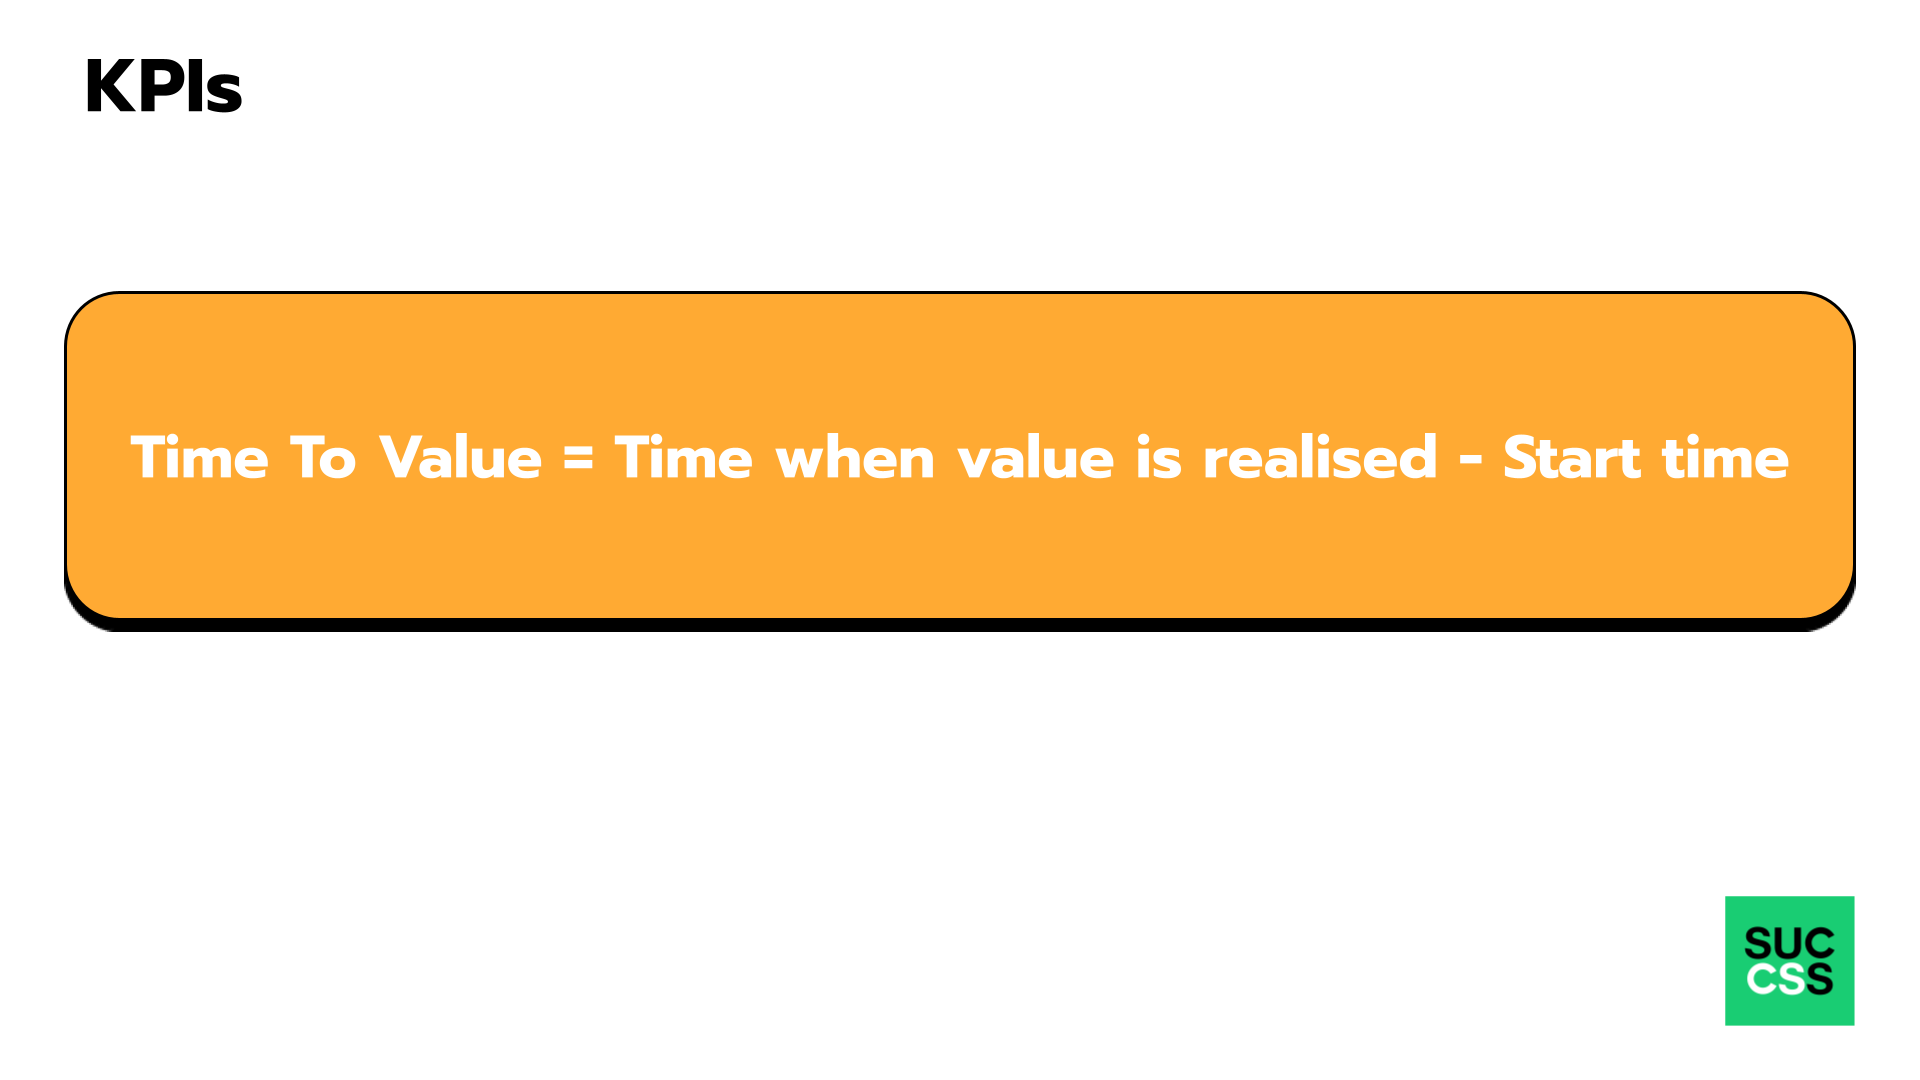
3. Time to Value
How quickly can customers go from "I just bought this" to "Wow, this is awesome"? The faster they see value, the more likely they are to stick around. It's like the difference between a microwave dinner and waiting three hours for your food at a restaurant - sometimes faster is better. The time to value metric directly correlates with customer retention.
Identify the specific actions or touchpoints marking the customer’s initial engagement with your product. Then, determine the point at which the customer begins to experience tangible value or benefits from their interaction.
3. Engagement Metrics
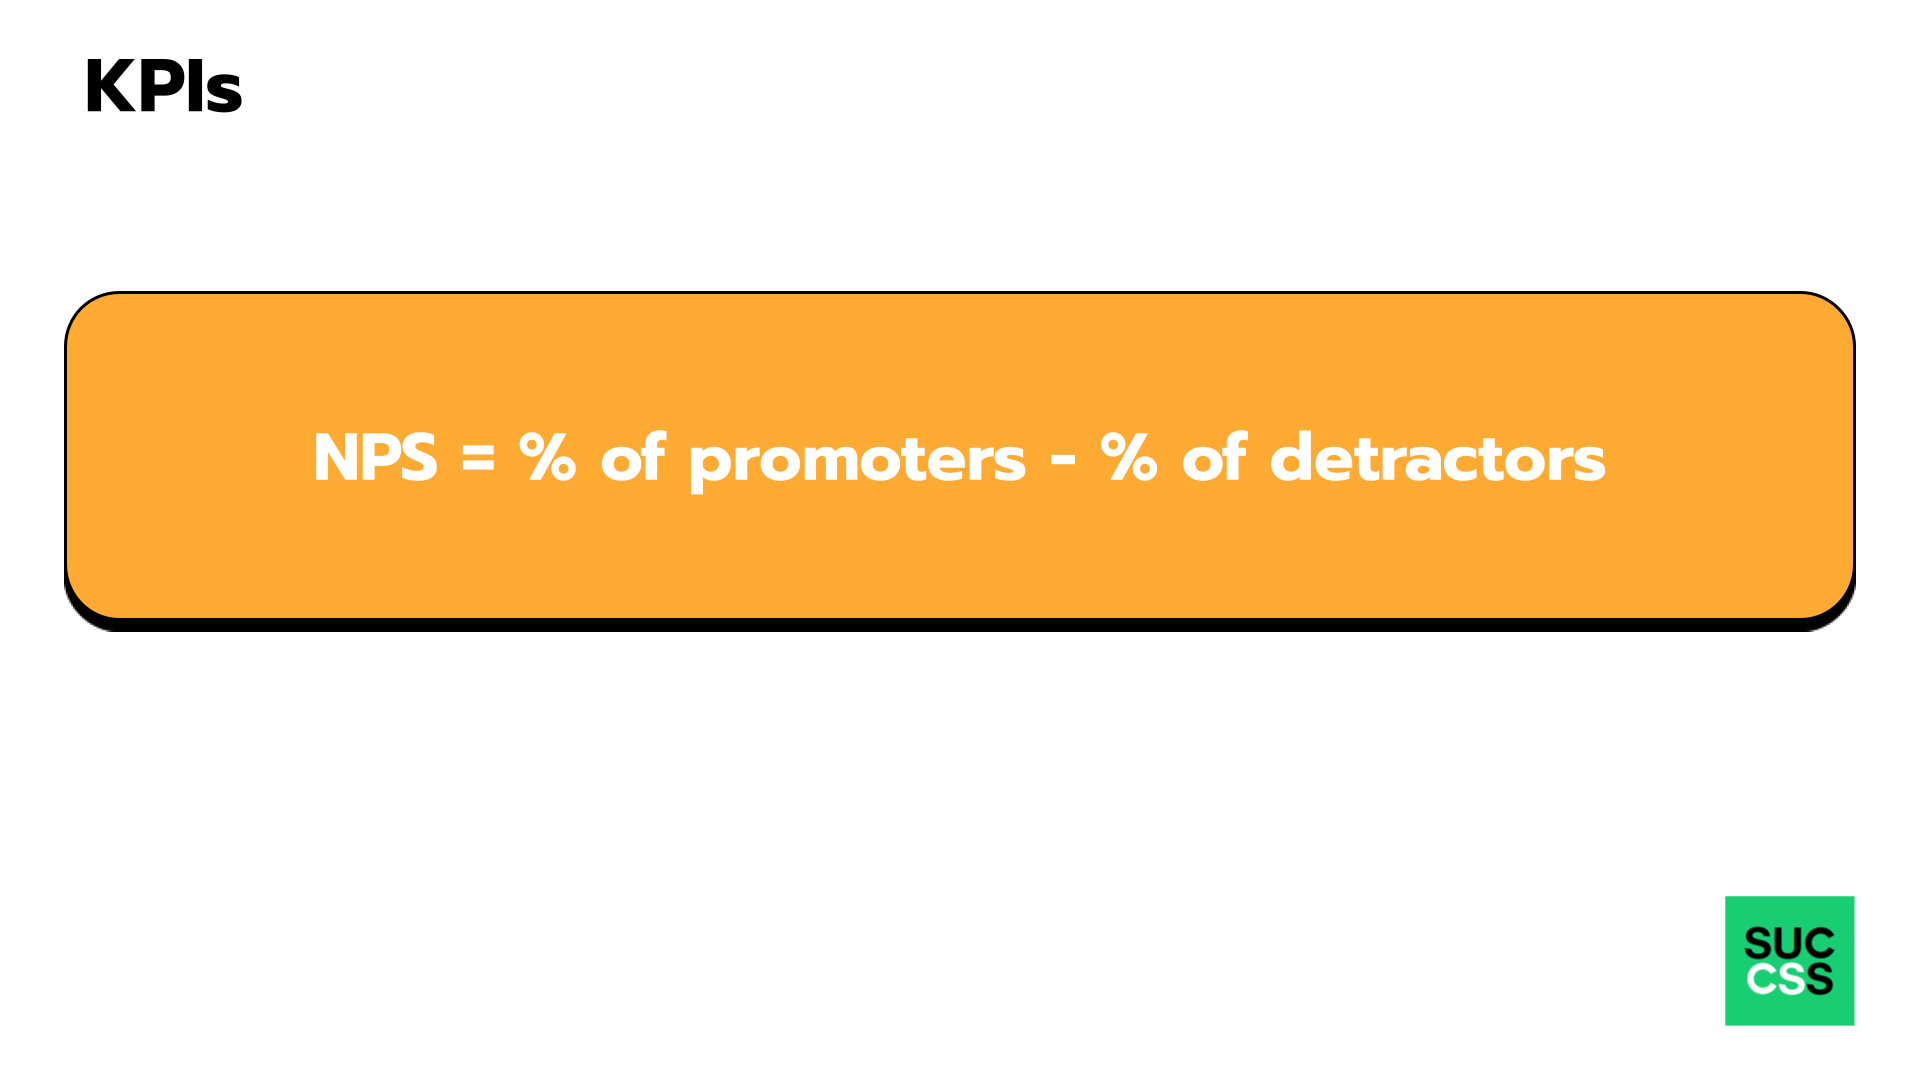
1. Net Promoter Score (NPS)
Look, we all want customers who rave about us to their friends. NPS tells you exactly who's singing your praises and who's... well, not so much. It's simple: ask customers "How likely are you to recommend us?" on a scale of 0-10. The magic happens when you sort them into three groups:
Your superfans (9-10)
The "meh" crowd (7-8)
The folks who might tell their friends to run the other way (0-6)
Quick math: subtract the percentage of haters from your superfans. Anything above 30 is solid, above 50 is fantastic, and above 71? You're basically the Beatles of your industry.
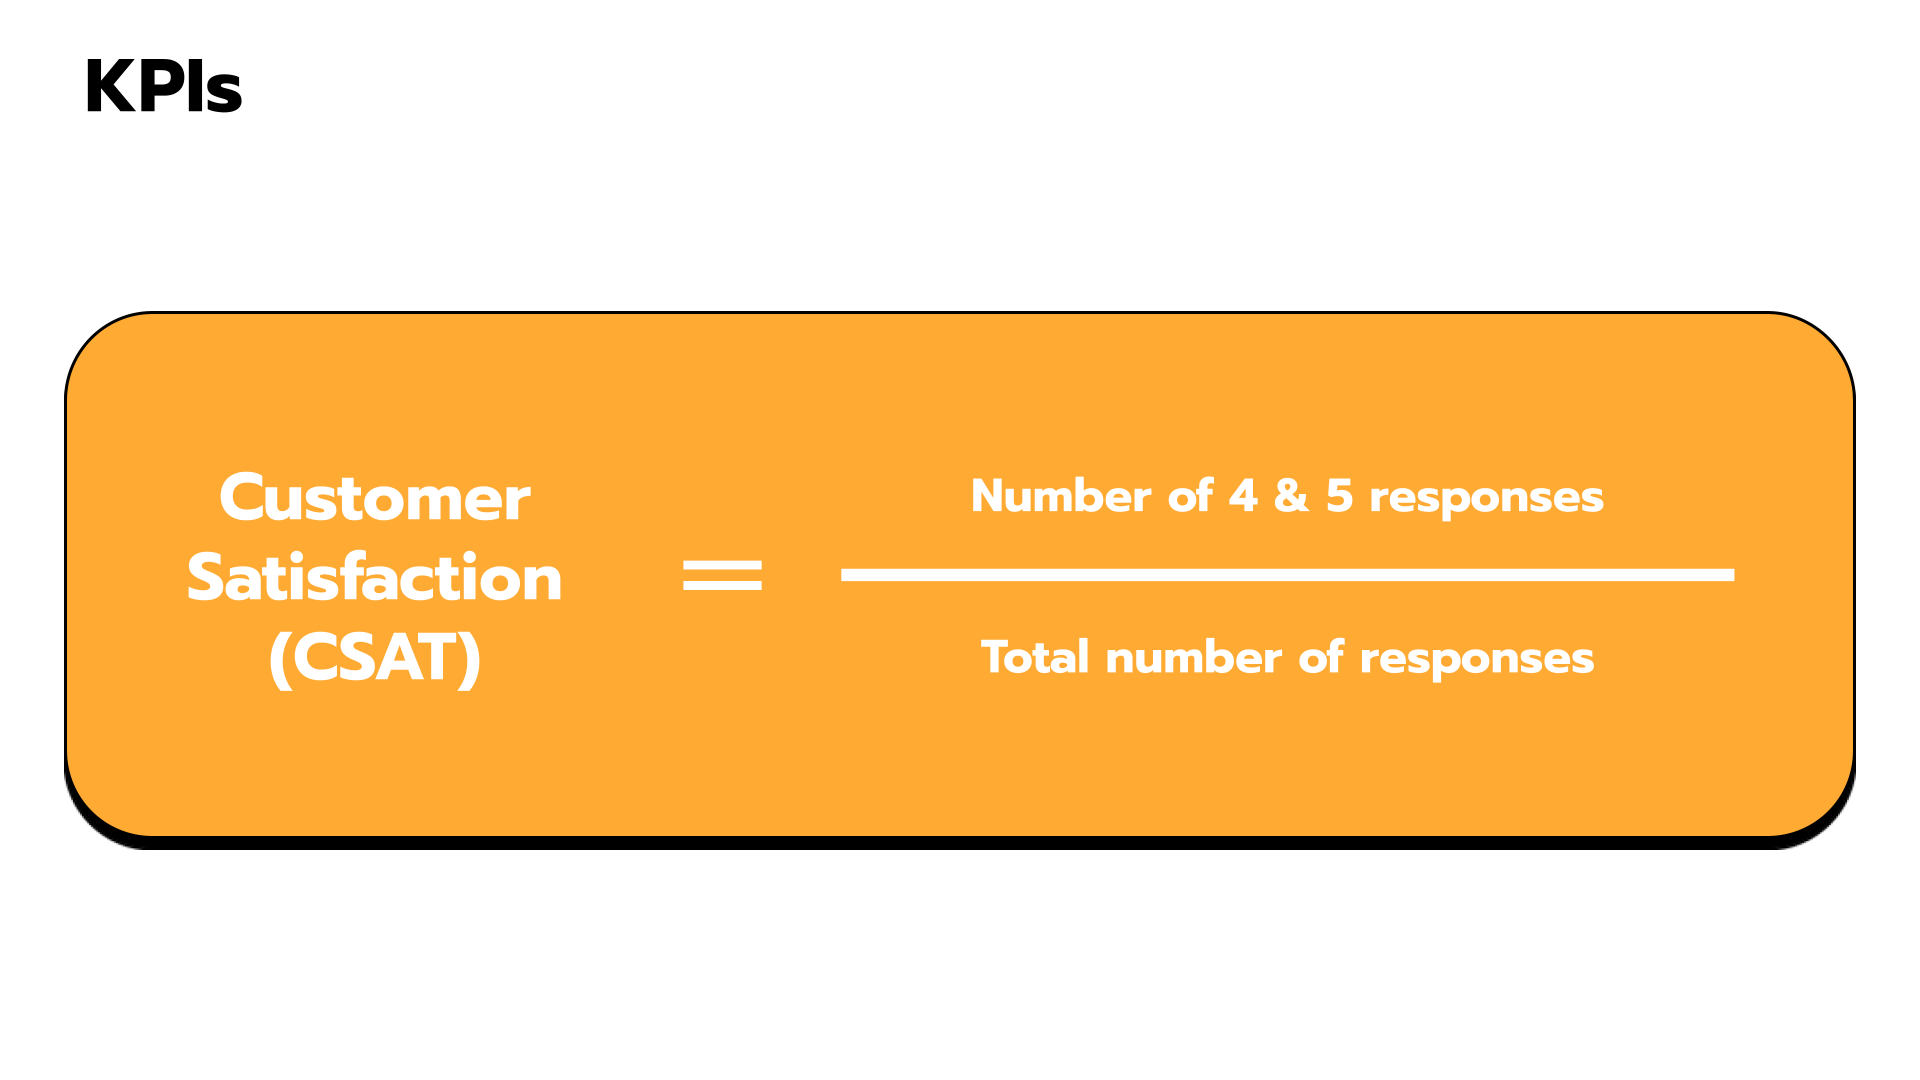
2. Customer Satisfaction (CSAT)
Here's a not-so-shocking revelation: happy customers tend to stick around and spend more money. CSAT helps you measure exactly how satisfied they are with specific interactions. Think of it as your customer success thermometer.
The first step to calculate your CSAT score is to create a survey asking customers how satisfied they are with your products or services, with a scale from 1 to 5 (1 being very unsatisfied and 5 being very satisfied). Alternatively, you can use a more straight-forward option which consists in a yes/no answer. It’s simpler but might not capture the different nuances of dissatisfaction.
Once you have collected data from your survey, take the number of customers that rated you 4 or 5 and divide that by the total number of responses.
3. Customer Health Score
Think of this as your early warning system. First, decide what you to accomplish: increase customer loyalty or reduce churn by 15% a year from now.
Taking the example of preventing churn, think of it as your weather radar: it helps you spot the storm clouds before it starts raining cancellations. You'll want to track things like:
How long they've been with you
How much they're actually using your product (the frequency, breadth and depth of their usage)
Whether they're submitting support tickets
If they're upgrading or just sitting still
CSAT/NPS data
Quick tip: try looking at product usage metrics in terms of frequency, breadth and depth.
There are two main ways to do this:
Frequency: it refers to how often the product is accessed, i.e. the frequency at which customers log into the app and use its features.
Breadth: look at the ratio of customer that do something, such as a conversion or utilization rate (i.e. users using / total users).
Depth: the level of interaction that users have with your product, i.e. which features they use.
Once mapped, you’ll need to set up a scoring system to measure how your customer are doing. Let’s imagine a scoring system from 0 to 100. You’ll want to assign a “weight” to each of the 5 KPIs identified above, starting at 50 (10 points per KPI).
Based on the activity of each customer, you’ll want to define rules. For example: add 5 points to the Health Score if the client uses advanced feature, remove 5 points if they submits negative CSAT feedback.
Finally, don’t forget to visualise the health score of your customers
Color code (Red: churn risk, Yellow: needs attention, Green: all good)
Red: for any score below 30/100
Yellow: any score between 30/100 and 70/100
Green: any score above 70/100
Alphabetical scale (C: churn risk, B: needs attention, A: all good)
C: for any score below 30/100
B: any score between 30/100 and 70/100
C: any score above 70/100
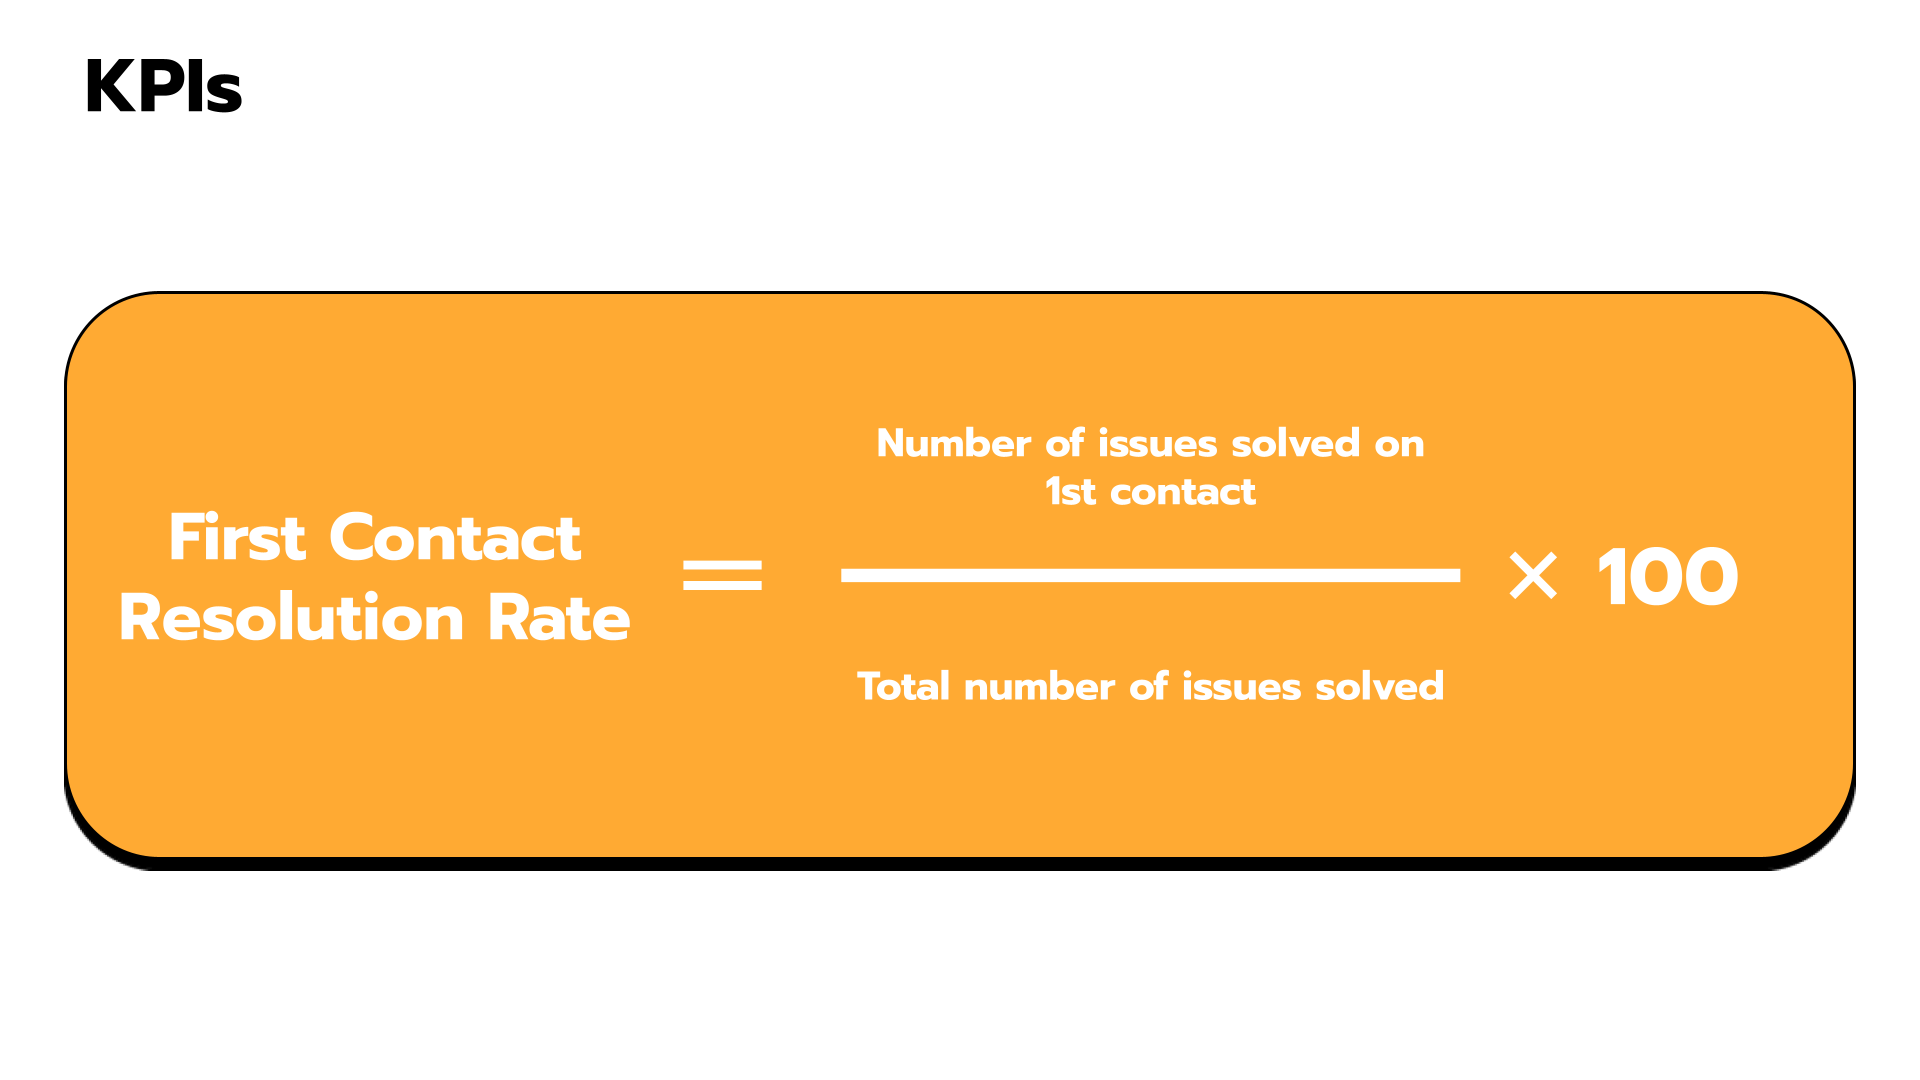
4. First Contact Resolution (FCR) Rate
Nobody likes having to explain their problem six times to six different people. FCR measures how often you solve customer issues on the first try. It's the difference between "Thanks, that fixed it!" and "Please not another transfer..."
How to calculate the FCR rate?
Divide the number of tickets resolved on the first contact by the total number of tickets handled by agents. To get the corresponding percentage, multiply the result by 100.
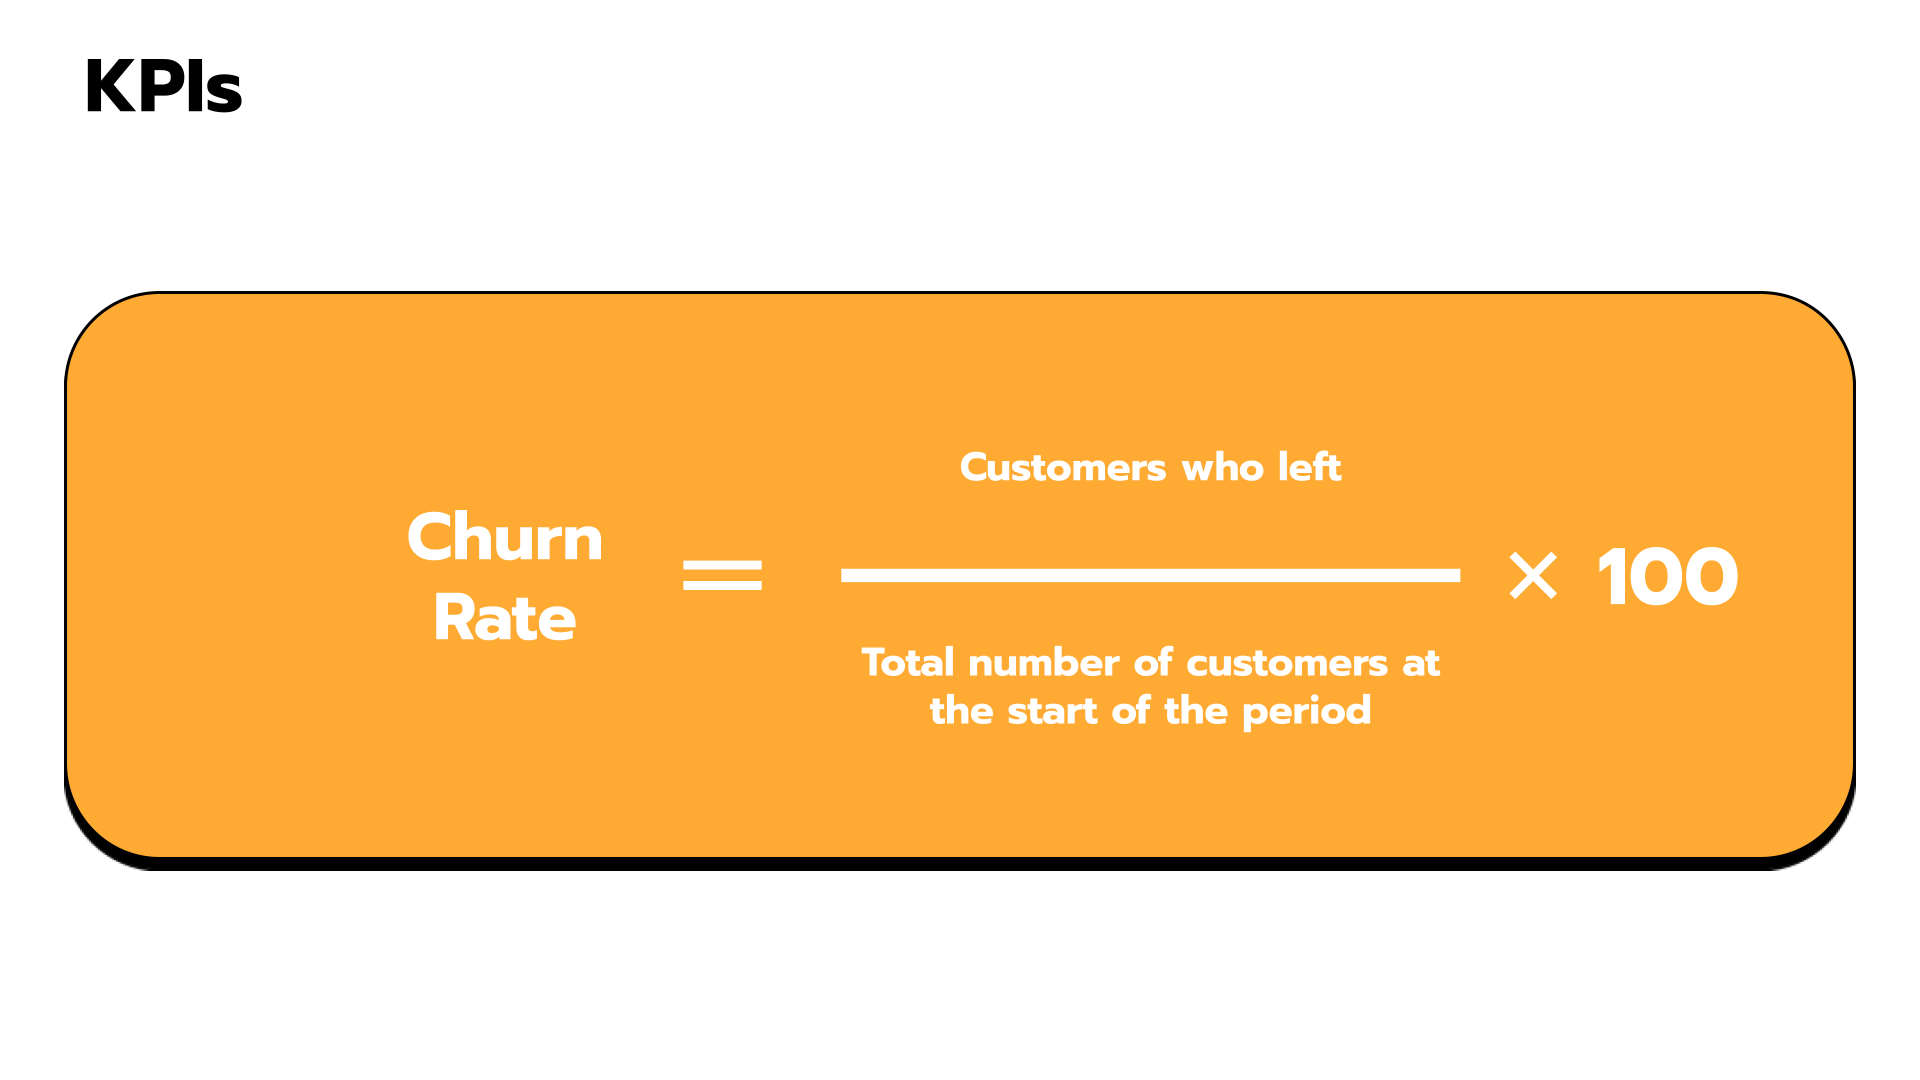
5. Churn Rate
The dreaded breakup metric. How many customers are waving goodbye? It measures the percentage of customers who cancel a subscription or don’t renew it for a given period of time.
A low customer churn rate means that most of your customers are paying for your product or service.
On the other hand, a high churn rate means that customers are leaving in droves and canceling their subscriptions at an alarming pace. A high churn rate is like having a bucket with holes - you can keep adding water (customers), but you'll never fill it up until you fix those holes. That’s why it’s one of the most critical metric for CS teams (and subscription-based businesses).
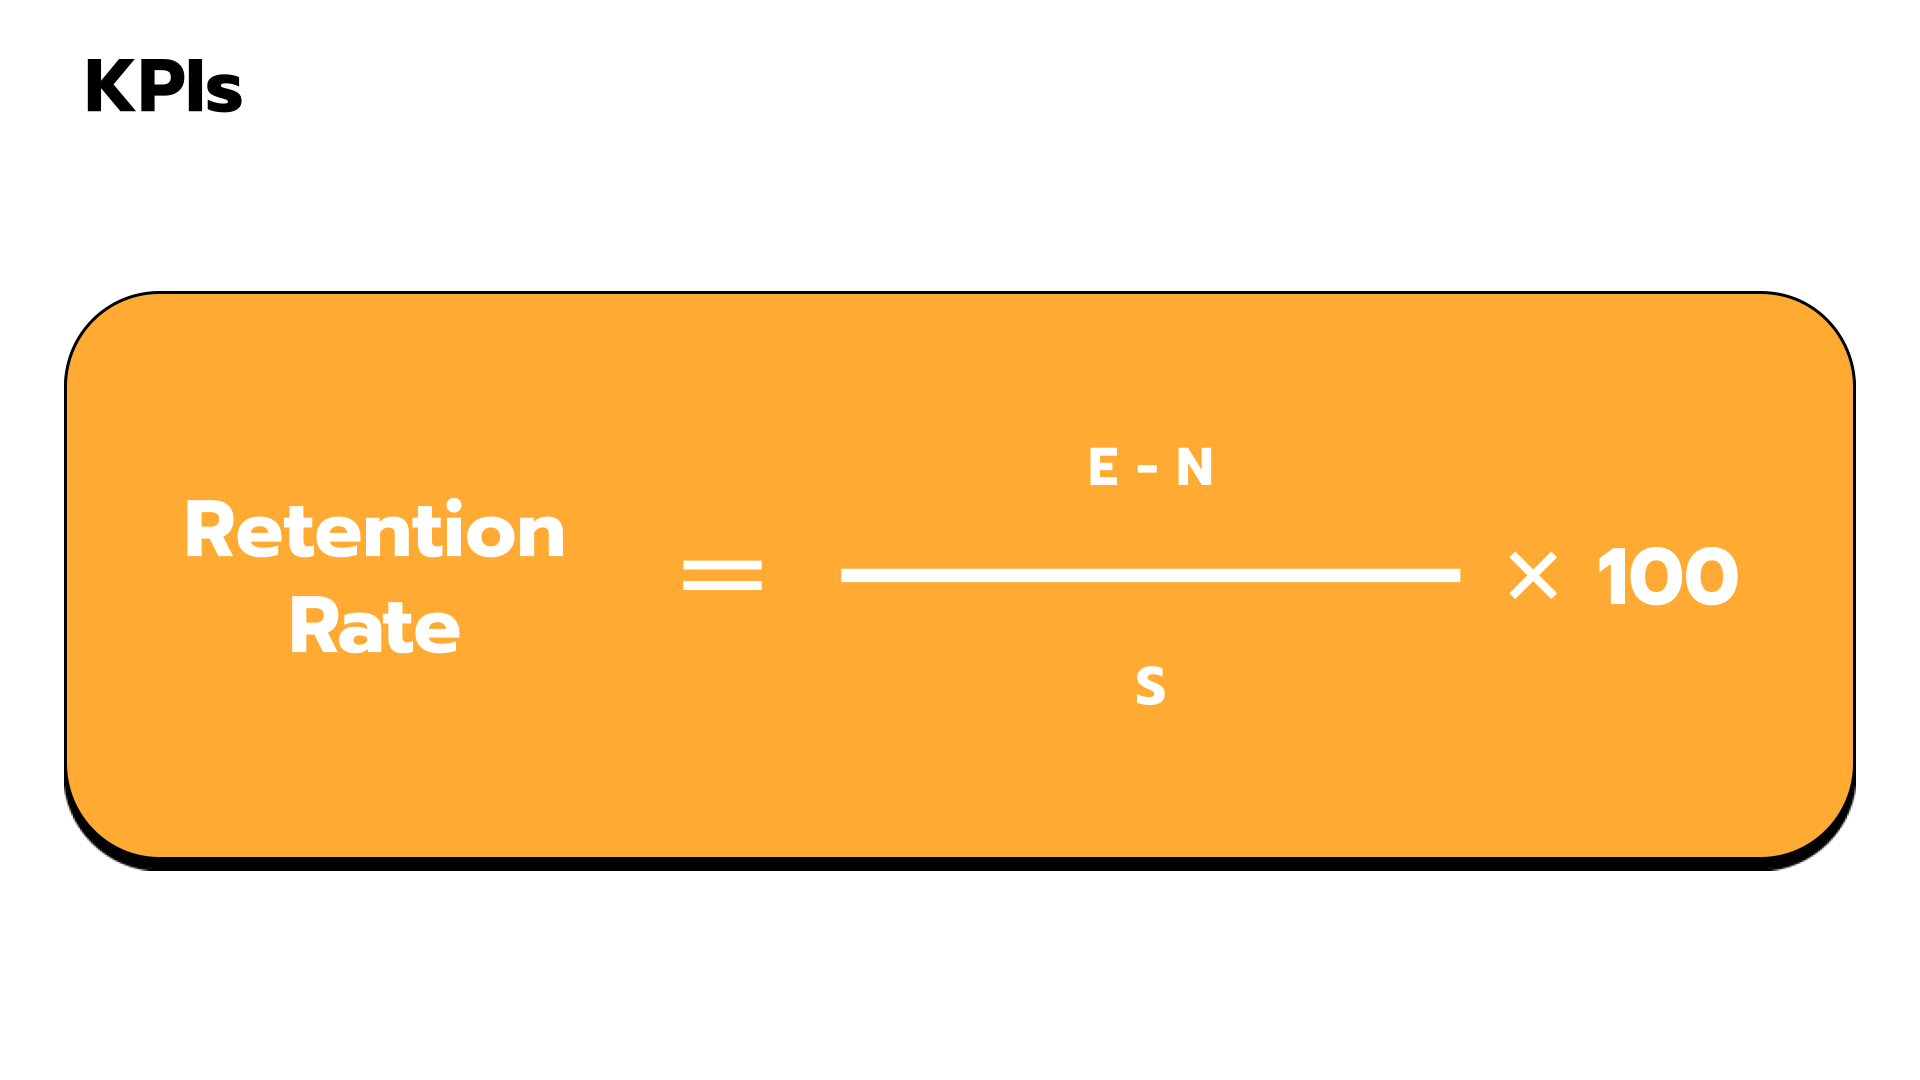
6. Customer Retention Rate
Customer Retention rate is the percentage of customers who continue to pay for their subscription over a particular period.
The formula goes like this:
Calculate the number of customers you have at the end of the period (E)
Deduct the number of new customers acquired during the period (N)
Divide the result by the number of customers at the beginning of the period (S)
Finally, multiply the result by 100 to get the percentage
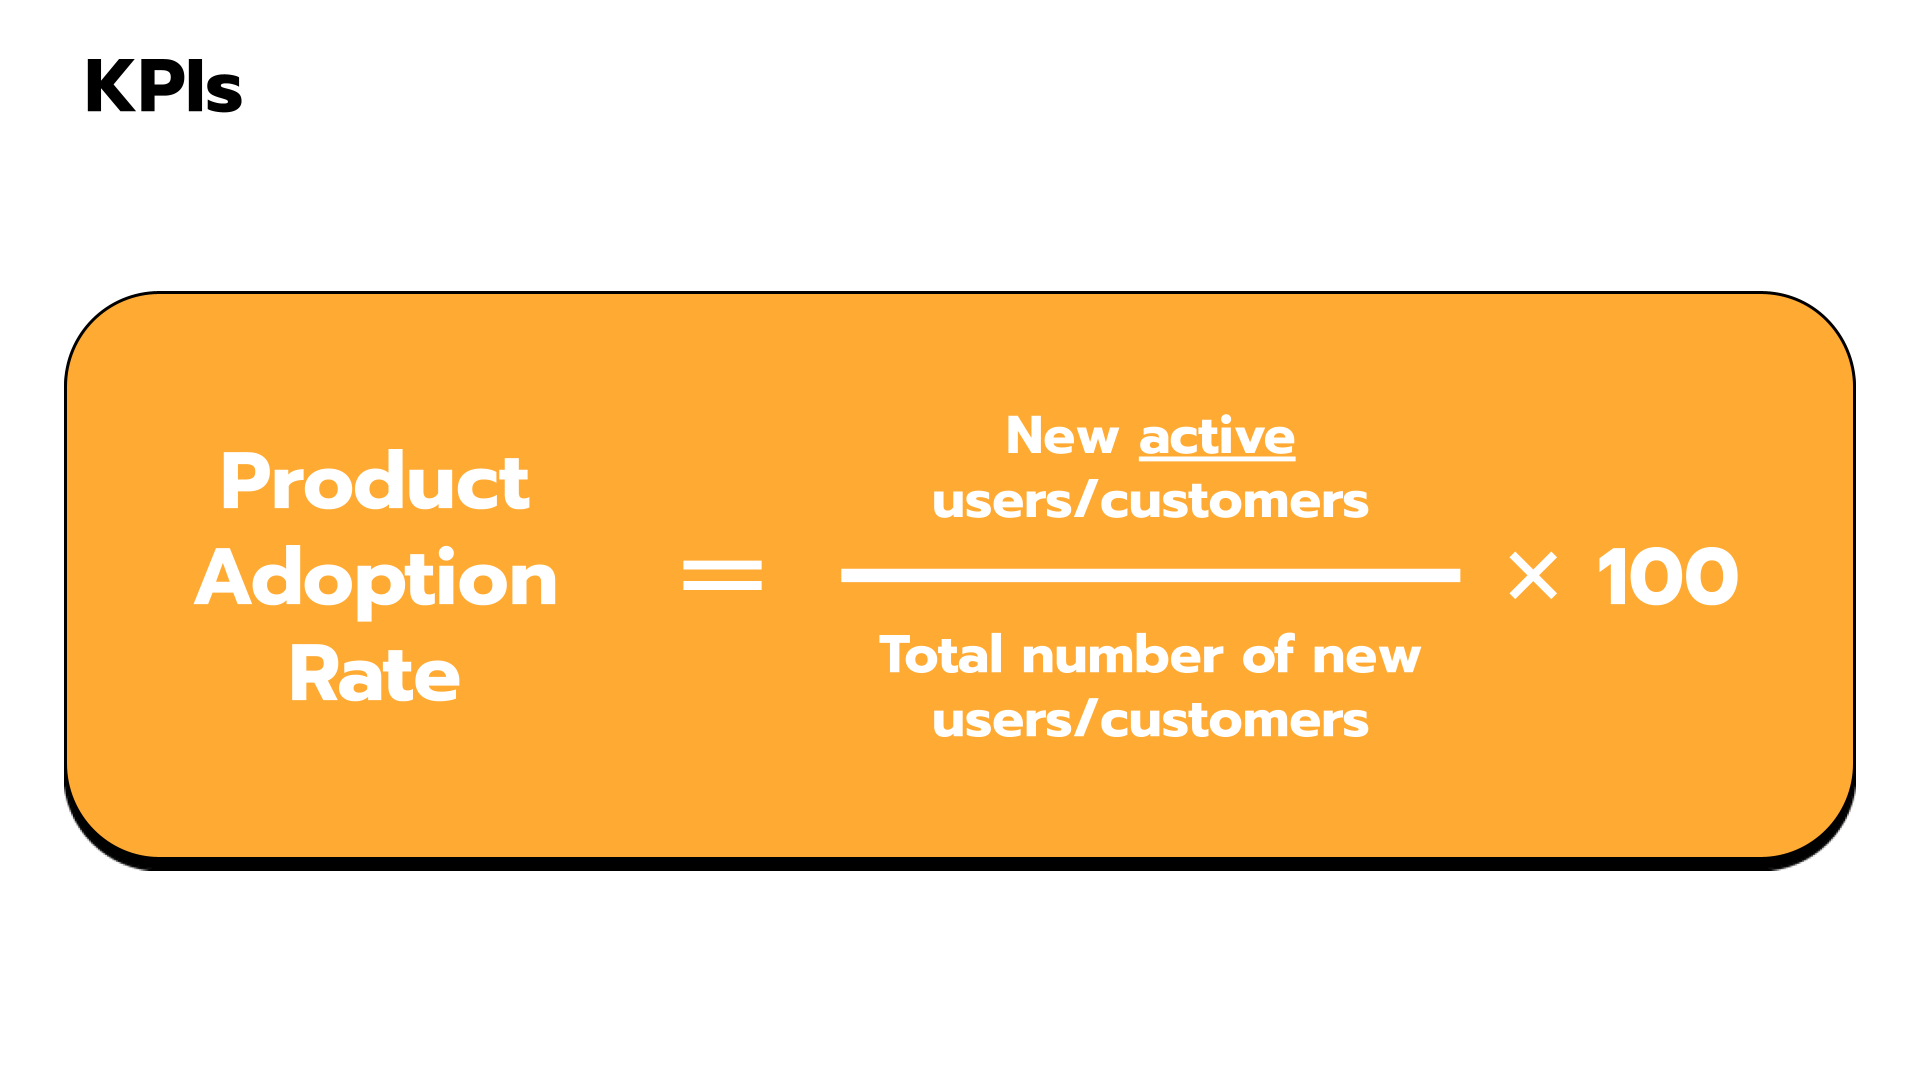
7. Product adoption rate
Product or service adoption rate is the number of new free users/customers using a key feature (even better: integrating your product with one of their tools) against the total number of new free users/customers within a set timeframe.
This metric gives you precious insights into the ease-of-use & quality of your product and the effectiveness of the CS team in guiding new users/customers in adopting it.
In order to measure it, you first need to define what qualifies as an active users. Using the example above, you can assume that an active customer uses at least 1 key feature (or integration). From experience, the key feature is also referred as “sticky feature” - meaning any functionality that makes users stay with you.
4. Revenue Metrics
1. Average Revenue Per Account (ARPA)
This one's straightforward: how much is each customer worth to you, on average? It can be measured over different periods – monthly or yearly.
It’s an essential profitability metric because it allows you to forecast predictable revenue and future growth.
Pretty useful too: when analysing and segmenting subscribers, it helps identify the most profitable plans/products.
To determine ARPA for a given period, you have to divide the company’s revenue for a given timeframe by the number of accounts for the same timeframe.

2. Customer Lifetime Value (CLV)
Think of CLV as the "long game" metric. It's not about what customers spend today - it's about what they'll spend over their entire relationship with you. It's the difference between selling one cup of coffee and knowing you've got a customer who'll buy their morning brew from you for the next five years.
CLV measures the total revenue a company can generate from a typical customer over the period they remain active with a company. To maximise CLV, it’s paramount to understand what drives customer retention and loyalty. Plus, balancing CLTV with other factors like customer acquisition cost helps build growth strategies.
Anyway, back to the nitty-gritty stuff: CLV is measured by multiplying ARPA, the average customer lifespan and the purchase frequency.
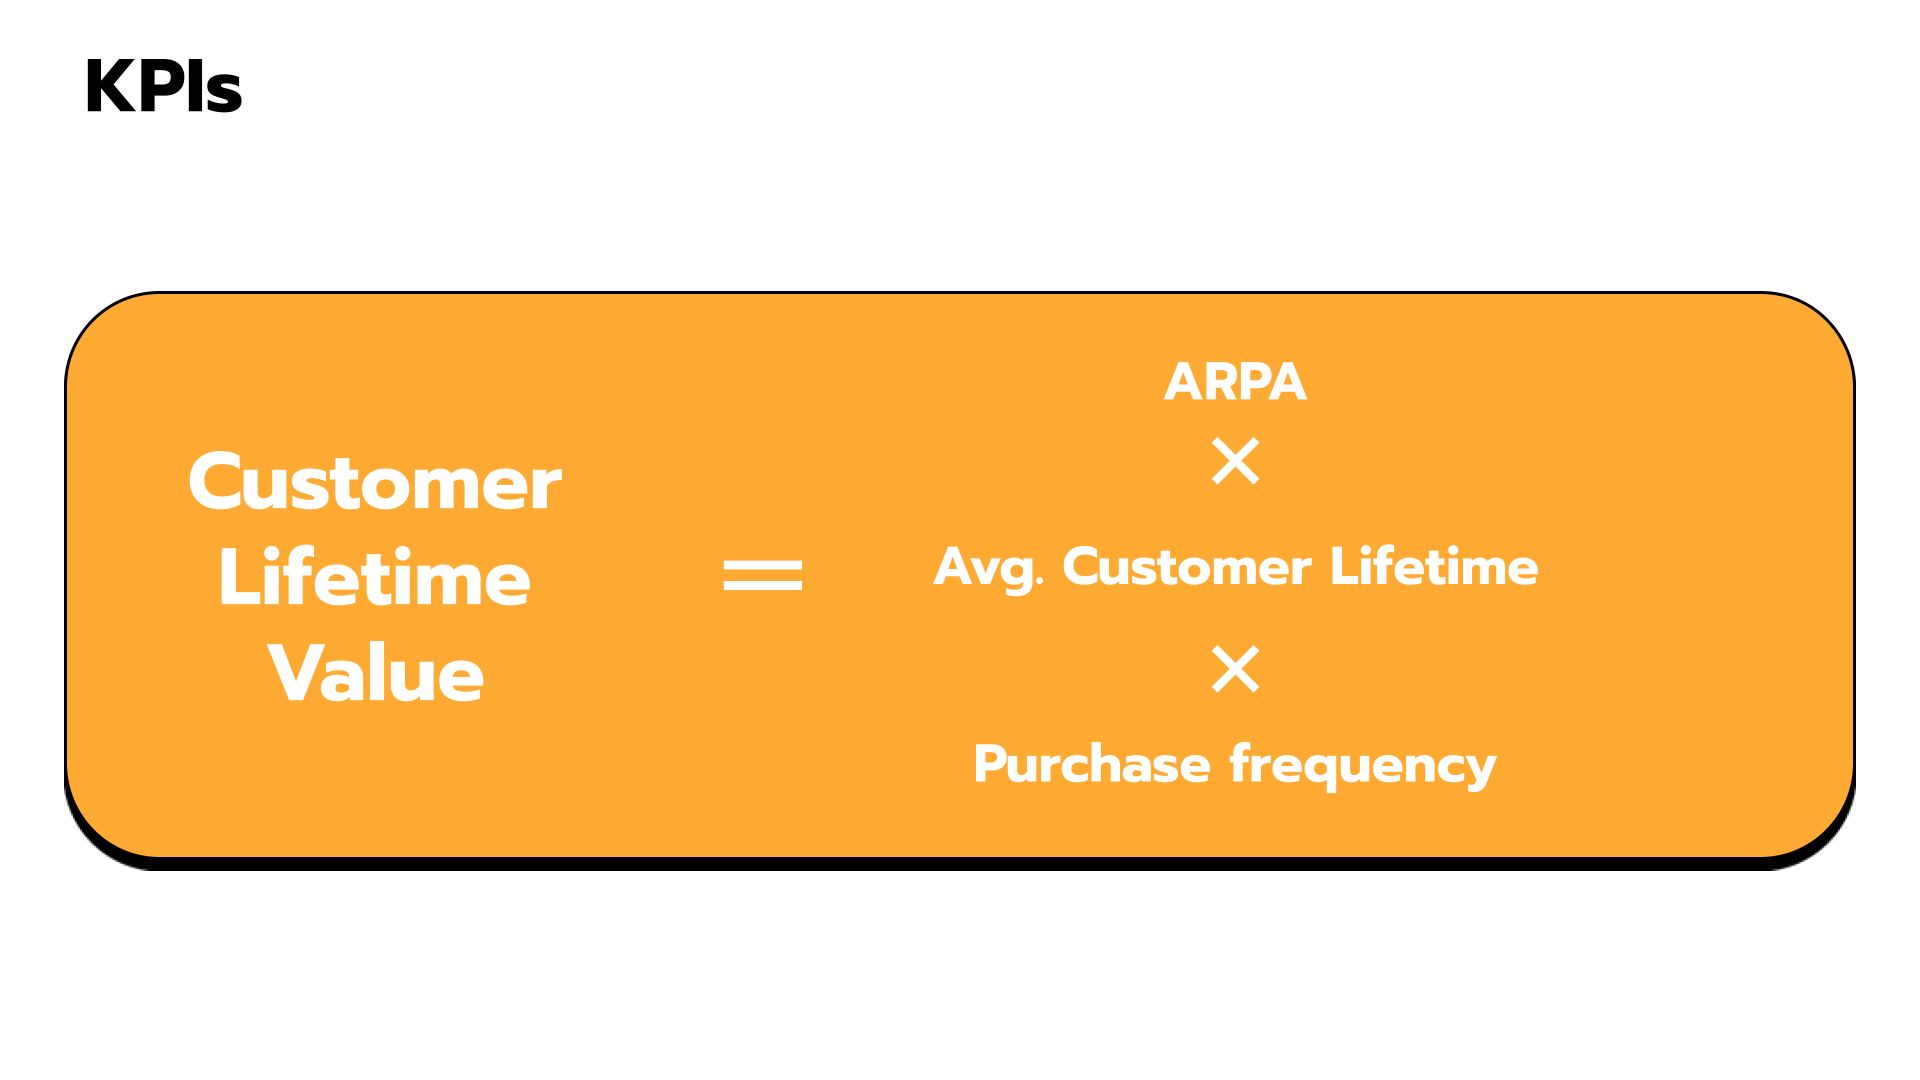
Make sure you’re looking at the right time frame for your ARPA and Avg. Customer Lifetime. If those metrics are measured on a monthly basis, the frequency is 12 (since they pay every month). If it’s on a yearly basis, the frequency is 1.
3. Renewal Rate
The renewal rate refers to the percentage of customers who renew their subscriptions over a given period.
Find out how many customers renewed their subscriptions during a set timeframe. Then, divide this figure by the total number of customers eligible for renewal in that period. Multiply the outcome by 100 to obtain the renewal rate as a percentage.

Renewal rate and retention rate are often used interchangeably. However, there are some key differences — primarily in the customer intent.
Renewal rate is the measure of customers who actively choose contract renewal. It tells you how many customers choose to renew their contract at a given time.
Retention rate, on the other hand, refers to customers who had chosen not to cancel their subscription even when they had the chance to. This could either be an automatic decision or an active decision on their part to renew the contract. It tells you how many customers you have been able to retain over a time period.
The renewal rate is particularly important for CS teams focused on particular segments of customers rather than the entire customer base. As a CSMs or CS leader, your renewal rate should be higher than the company’s retention rate - if you’re doing a good job that is.
Important: don't try to track everything at once. Pick the metrics that align with your biggest business challenges right now. If you're losing customers, focus on churn and health scores. If you're struggling with support, zero in on FCR and CSAT.
4. Leading & Lagging indicators
Having listed these metrics was the first step. Now, you need to understand how to use them and take actions. You know how your doctor checks both your current health and risk factors for future issues? That's exactly what leading and lagging indicators do.
Think of lagging indicators as your report card - they tell you how you've already done. Pretty straightforward stuff like renewal numbers, expansion figures, and other things you can't change because, well, they've already happened. It's like looking at your bank statement from last month - interesting to know, but you can't go back and undo those late-night Amazon purchases.
Now, leading indicators? They're more like your crystal ball. They help you spot trends before they become problems (or opportunities). But here's the tricky part - picking the right leading indicators is kind of like choosing which weather signs to watch. Sure, dark clouds might mean rain, but not always.
1. Lagging Indicators
Let's make this super practical. For CS teams (and SaaS companies more broadly), lagging indicators would be things like:
Monthly recurring revenue (MRR)
Average revenue per account (ARPA)
Net revenue retention (NRR)
Gross revenue retention (GRR)
2. Leading Indicators
Leading indicators - our early warning system - would be:
Session duration (how long people actually stick around in the app)
Number of sessions (because logging in once and never coming back isn't exactly a success story)
Activation rate (are users actually doing the important stuff, or just window shopping?)
Here's a real-world example that'll make this click: Facebook figured out that if users made seven friends in their first ten days, they were probably hooked for good. That's their "north star" metric - like the canary in the coal mine, but for social media success.
3. Now what?
Use both types of indicators, but use them smart:
Track leading indicators like a hawk - weekly or even daily. They're your early warning system.
Review lagging indicators monthly or quarterly, like checking your report card.
Make sure your leading indicators actually point to something meaningful. If your "canary" keeps singing while the business tanks, you might be watching the wrong bird.
The key? Finding the perfect mix. It's like cooking - everyone has different taste buds, and what works for one company might be a disaster for another.
Remember: Leading indicators let you change the future, while lagging indicators help you learn from the past. You need both to successfully manage your book of clients or the entire CS team - just like you need both headlights and rearview mirrors to drive safely. Keep an eye on both, and you'll be much less likely to crash and burn.
And if your leading indicators are flashing red, don't panic - that's exactly what they're supposed to do. It means you still have time to fix things before they show up in next quarter's numbers. Think of it as your version of a "check engine" light - annoying, but way better than finding out about problems after your engine's already smoking.
5. Conclusion
After diving into these metrics - from NPS and CSAT to the money-tracking metrics like CLV and churn rate - you've got the tools to keep your finger on your operations’ pulse. Think of it as having both a crystal ball (your leading indicators like engagement rates) and a report card (your lagging indicators like revenue) working together to give you the full picture.
The real power comes from combining them: use those leading indicators to spot storms before they hit, and let the lagging ones tell you if your umbrella strategies are actually working. The key isn't just collecting these numbers - it's about using them to make smarter decisions faster.
So pick your metrics wisely, keep your eyes on both the horizon and the rearview mirror.